Backlogs in court case processing are not new and have been a focus of the National Center for State Courts (NCSC) since its founding. Justice Delayed: The Pace of Litigation in Urban Trial Courts was published in 1978 on this very issue. But the conversation around backlog is more relevant now than ever. The COVID-19 pandemic had a dramatic effect on the courts, not the least of which included unprecedented rises in pending cases nationally in 2021 and 2022.
Growth in pending caseload can result when the number of filings exceeds dispositions and when existing cases take a long time to dispose. While there is no national data available on the extent of “old” pending cases (or backlog) across state courts, this article will explore recent trends in pending caseloads before introducing a definition of backlog and a new tool to help courts address it.
What Is Known About Court Caseloads Since the Pandemic?
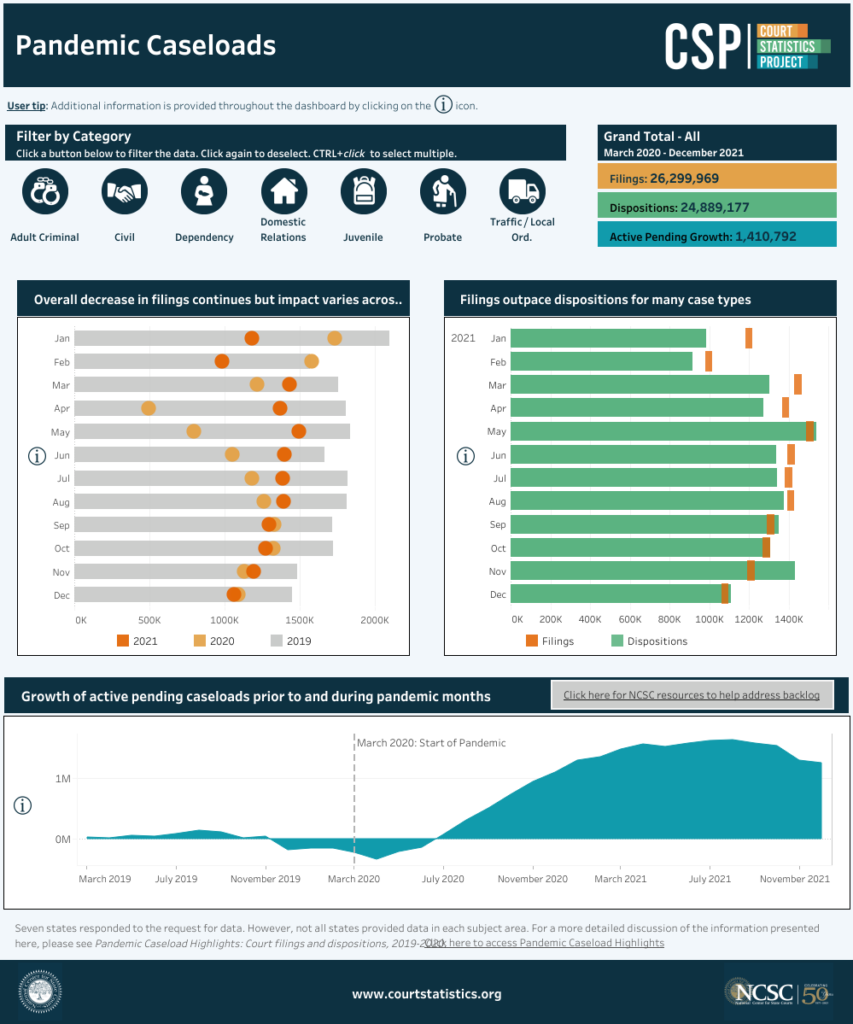
NCSC collects aggregate data annually for up to 39 states on caseload measures like filings, dispositions, and clearance rates through the Court Statistics Project (CSP). CSP has also produced a pandemic caseload dashboard, depicted in the figure below (from January 2023). This dashboard was designed to show three key comparisons across case types:
- The difference in monthly court case filings from 2019 to 2021;
- The relationship between monthly filings and monthly dispositions in 2021; and
- The change in active pending caseloads before and after March of 2020.
Perhaps not surprisingly, these data show that filings across all case types remained below 2019 levels through 2021. Moreover, for most of 2021, monthly filings outpaced monthly dispositions. When the number of dispositions does not keep up with the number of filings, the pending caseload grows. This is shown by the steep upward trend in pending cases starting around July of 2020 (see the chart at the bottom of Figure 1).
Not all pending cases are considered backlog, but a portion undoubtably are. This lag in dispositions relative to case filings, along with the known challenges that courts have faced disposing of cases during this time, suggests that case backlogs have also grown. Updated national data would be needed to parse out the share of pending cases that are backlogged and how this has changed before and after the start of the pandemic.
What Is Backlog and Why Is It Important?
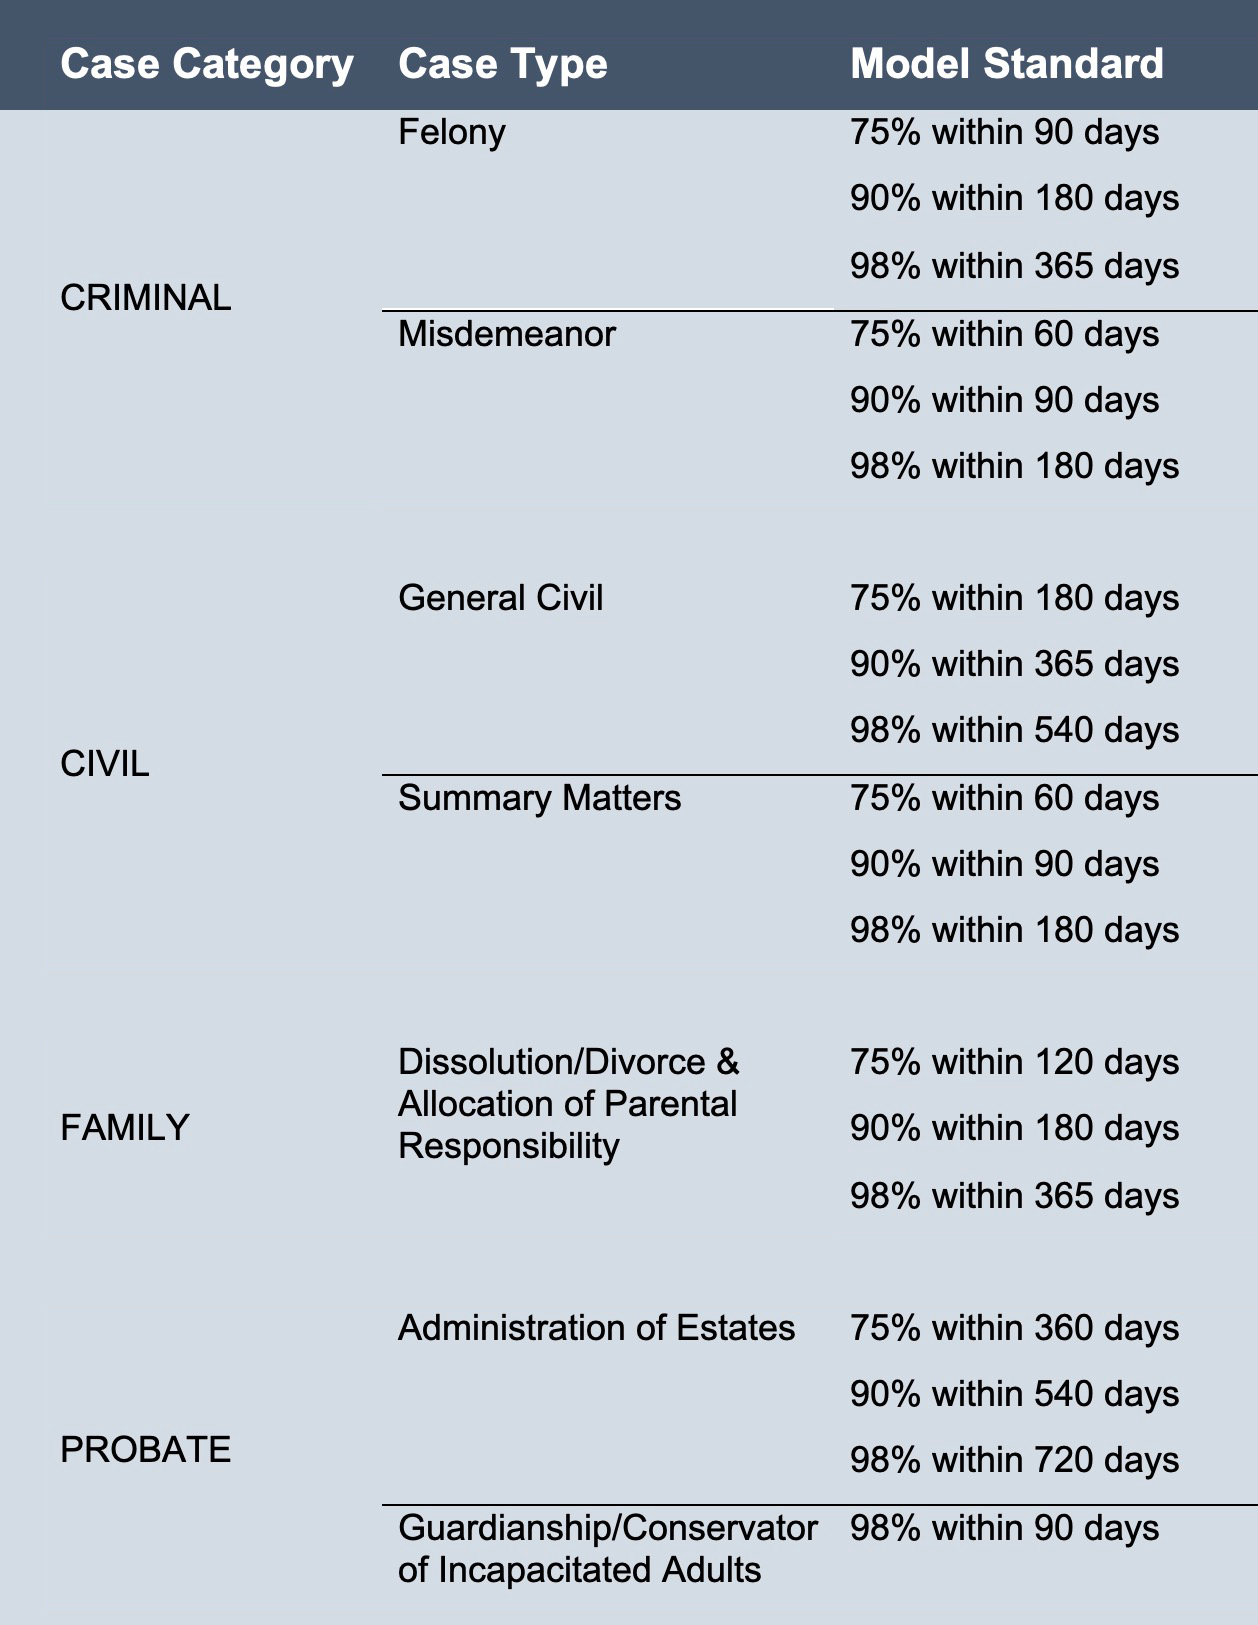
All courts have pending caseloads, but not all pending cases are part of a backlog. Backlog refers to a set of cases that have been pending beyond an acceptable time frame. This time frame can depend on the court and type of case being handled, but it is usually established as a performance standard or goal. The Conference of Chief Justices (CCJ), the Conference of State Court Administrators (COSCA), and the American Bar Association (ABA) developed time standards by case type to provide a framework for measuring case timeliness. These model time standards were designed to encourage the fair disposition of cases at the earliest possible time. They were made available as a basis for state judiciaries to either establish their own time standards or adopt the model standards.
For each case category and type, the standards provide time periods, in days, for which 75 percent, 90 percent, and 98 percent of filed cases should be disposed. Figure 2 summarizes a sample of these time frames for select case types. For instance, the target for felony cases is 98 percent disposed within 365 days. There is no 100 percent category in recognition that there will always be some cases that are highly complex and require more time to resolve. The 98% percent tier represents the maximum time that it should take for most cases to be decided and is key to establishing a measure of backlog.
A court’s backlog is indicative of the efficiency of the caseflow process—how effectively cases can be processed and adjudicated in a timely manner. Efficiency matters not only because of statutory time requirements and, in the criminal context, individual liberties, but also because efficiency in case processing is an essential element in court users’ belief that they received justice. Just as though a person would not want to wait lengthy periods of time to address a health concern or to receive any other public service, lengthy court cases can undermine perceived legitimacy and trust in the courts to resolve disputes fairly.
While current national data are also needed to understand how case backlogs impact people involved in the courts, some research suggests that people may be less likely to turn to the courts with their legal issues, have quality experiences or “justice journeys,” or believe they should comply with court orders, in part, because of inefficiencies in the administration of justice. Prolonged court processes can have a detrimental effect on a person’s well-being and their ability to manage their other responsibilities, along with their court involvement. Delays also result in increased financial costs for the courts and the parties involved.
Court practitioners may express concern about a focus on increasing efficiency and reducing delay because they worry it may come at the expense of giving cases the attention and resources they require in favor of resolving cases as quickly as possible. However, we emphasize that efficiency is not about rapid case resolution, but rather good case management practices that can increase timely and just resolution, such as by ensuring all parties have adequate preparation time, making each court hearing productive, and limiting continuances.
Tackling the Backlog with the Court Backlog Reduction Simulator (CBRS)
A key component of tackling the backlog is being able to accurately determine how old cases are. This helps to understand the existence and extent of any backlog, measure changes over time, and inform efforts to address them. Many courts today can rely on their case management systems to track where cases are in the process, dates and upcoming events in the case, and the status of a case. Using this data is important for moving cases forward and preventing cases from falling through the cracks. Once backlogged cases have been identified, it is important to diagnose the factors that are contributing to the lengthy case processing and ensure that those cases receive the attention and interventions needed for resolution.
With funding from the State Justice Institute, NCSC developed a tool to assist with this—the Court Backlog Reduction Simulator (CBRS). The CBRS is a future-looking tool for courts to model what-if scenarios of future pending caseloads and backlogs. It relies on historical information on court performance to generate baseline simulations, or forecasts, of future outcomes.
An initial web-based version of the tool was launched in the summer of 2022. Ongoing updates will include additional features and functions over time, such as new forecasting algorithms, data upload and integration options, and additional reporting features. The tool is hosted online and can be used without an account; however, an account is recommended to enable all the features. It is specifically designed for use by court leaders and staff to input data from their existing reports and performance metrics.
Court users can use the tool to enter their aggregate data on case filings and dispositions for the last 12 months and create visualizations of those trends in pending cases, as well as a forecast of future pending caseload sizes. For courts that calculate age of active pending metrics, they can enter these totals into the tool to include a forecast of backlog. The tool has national time standards built into it for comparison, but courts can also input their own time goals (see Figure 3).

After establishing an initial picture, court users can see where they stand in relation to the established goals. Courts that regularly meet the benchmarks may benefit from continuing to monitor their performance with this tool. If they find that they are not meeting their goals, additional simulations can be performed to assess the changes needed. In this way, static performance metrics can now be made more dynamic and actionable for courts.
Using the CBRS
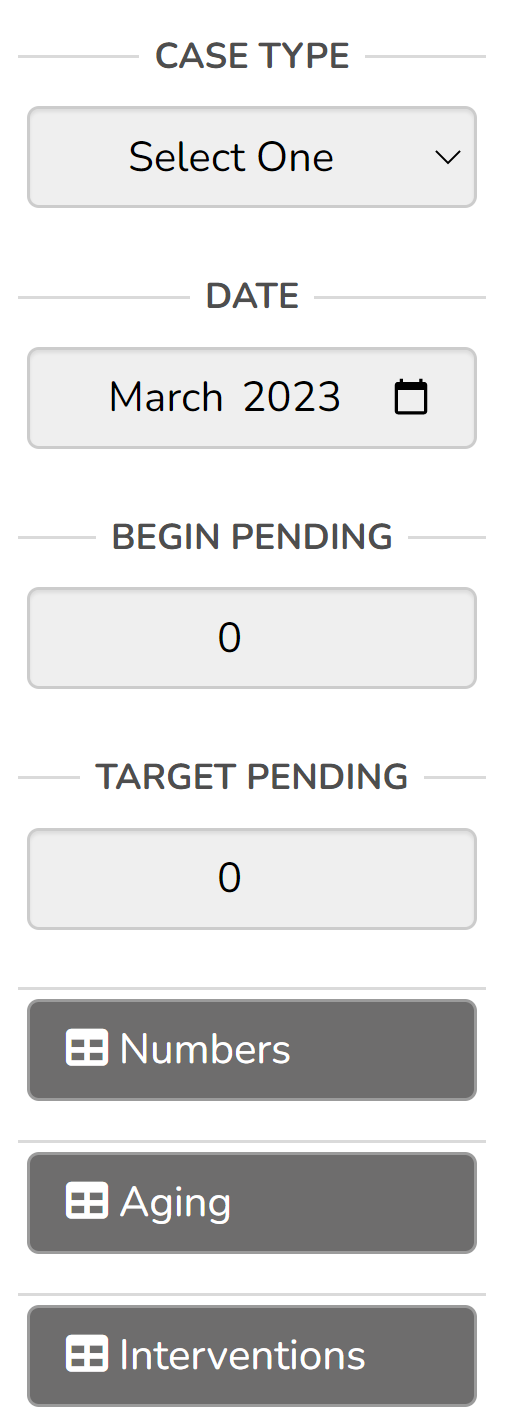
As previously mentioned, the CBRS requires users to enter basic data on the number of monthly court case filings and dispositions over a recent period. Figure 4 below shows the tool’s interface where users can input information on a specific case type. By clicking on “Numbers,” a box appears that lets users enter data on filings and dispositions. The case type, current month and year, and the number of cases pending at the beginning of this 12-month period should also be entered.
The remaining fields are optional but make the tool more powerful for court professionals looking to establish and work toward their backlog reduction goals. There is an optional field to enter a “Target Pending” number to compare the current number of cases against a specified caseload size. This might be based on a historical average or a workload goal. The “Aging” button is for data on the age of pending cases for the most recent period available and allows for the measurement of backlog. “Interventions” can be entered after reviewing the historical performance measures and simulations that serve as an initial baseline (see Figure 4).
Once the required fields are complete, the tool will create visualizations of historical trends in pending caseloads, clearance rates, filings, dispositions, and backlog and generate future forecasts of these measures. These initial forecasts show what may be expected if past trends continue. For courts with an average monthly clearance rate of under 100 percent, for instance, the tool will show growth in future pending cases (see Figure 5).
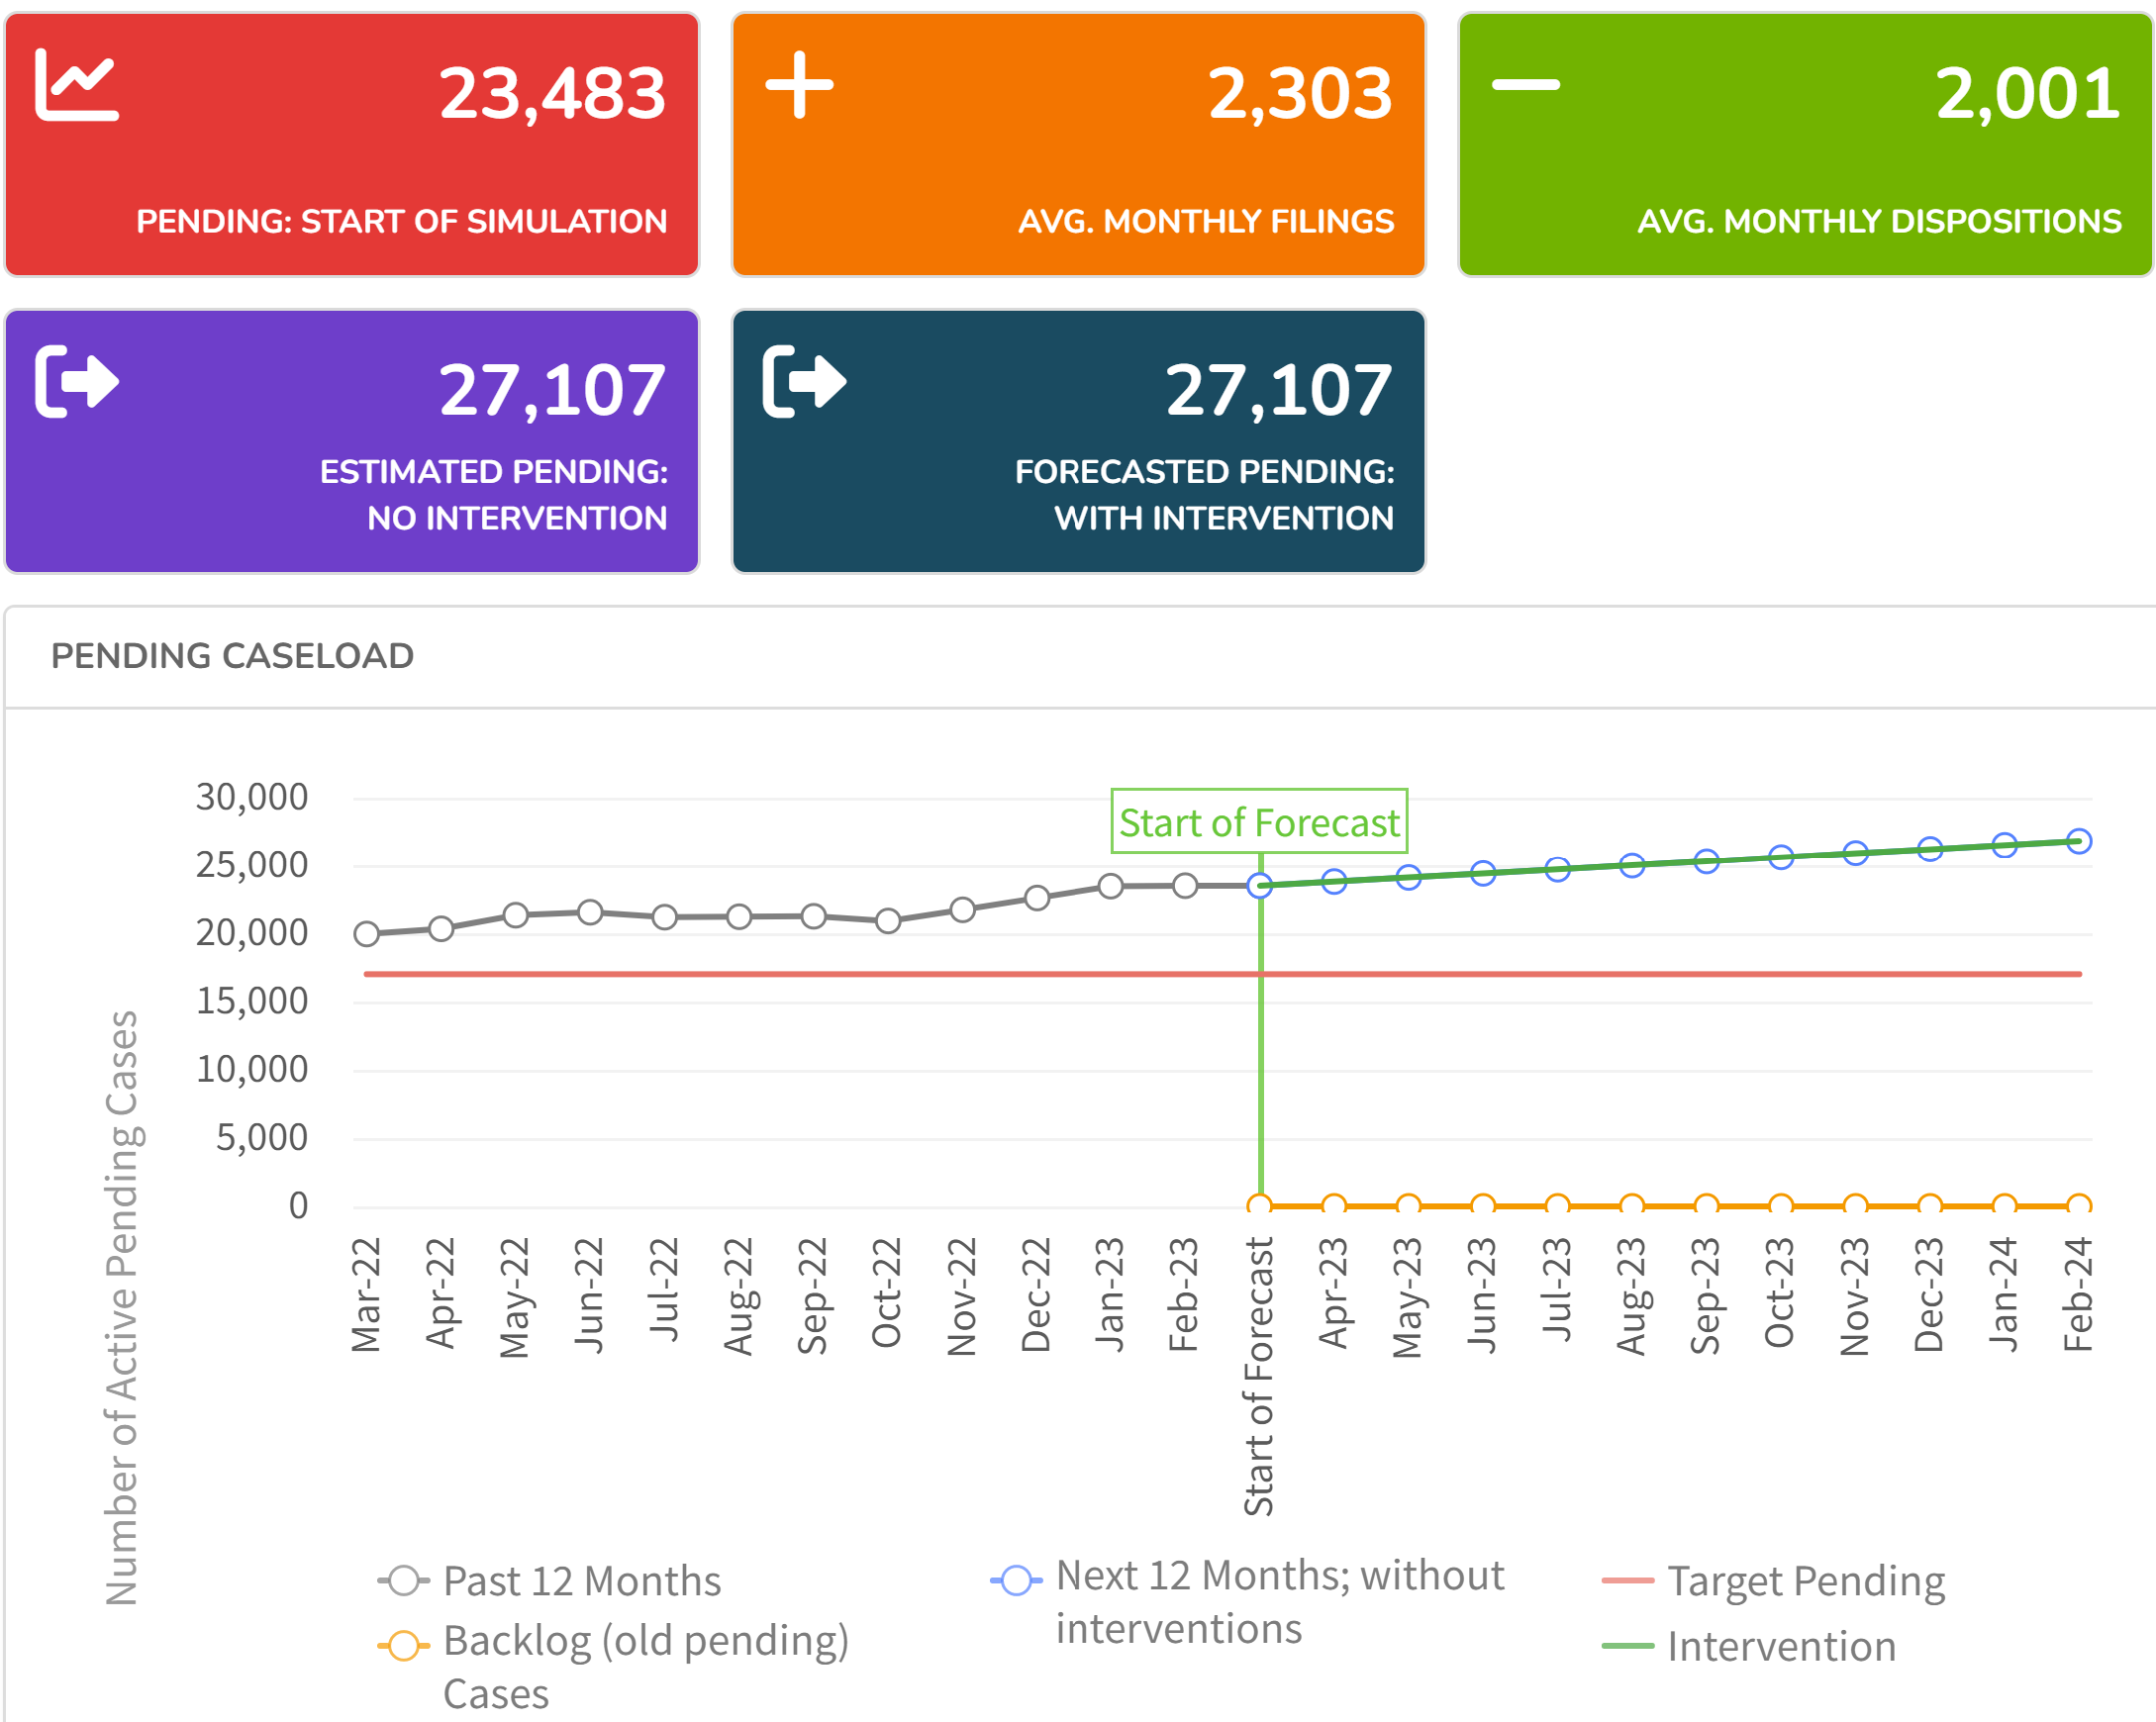
In this example, the case type of interest is criminal felonies, and the start month of the simulation is March 2023. After the historical information is entered in the “Numbers” field, an initial simulation or forecast of monthly pending cases appears. The blue line shows the increasing trend in pending without any interventions added that could reduce the pending caseload. Nothing has been entered into the “Aging” field, so the orange “Backlog” line is at zero (this does not mean that no cases are in backlog in this example).
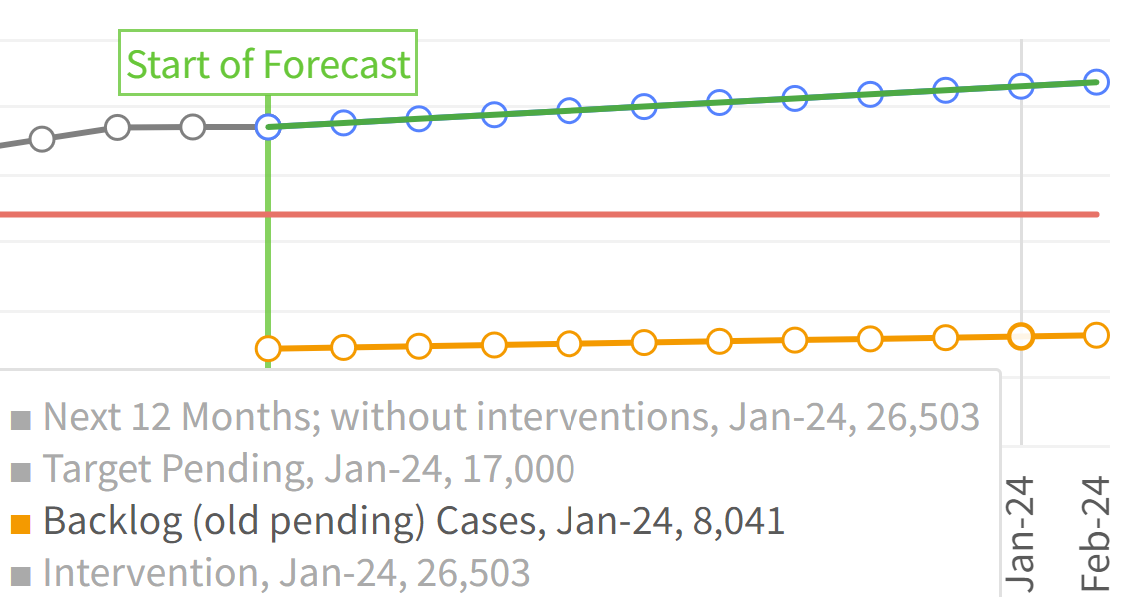
Before brainstorming and adding any interventions to reduce the overall number of pending cases, courts that have data on the current age of their pending caseload can also add that information to the tool. Based on this recent data, the tool presents a forecast of potential backlogs. Specific details are shown by hovering over each month in the graphic. In Figure 6, the tool forecasts that there will be 8,041 “backlogged” or old pending cases out of 26,503 total pending cases in January 2024. The “Intervention” metric can be ignored for now as no intervention has been added.
To see more specific information about these trends and forecasts, the tool also displays monthly clearance rates and monthly filings and dispositions. Figure 7 shows 24-month clearance rates. Again, 12 months are historical (March 2022-February 2023), and 12 months are forecasted numbers (March 2023-February 2024). The graph indicates months where the clearance rate exceeds 100 percent (as green bars) and months where it is under 100 percent (in gray).
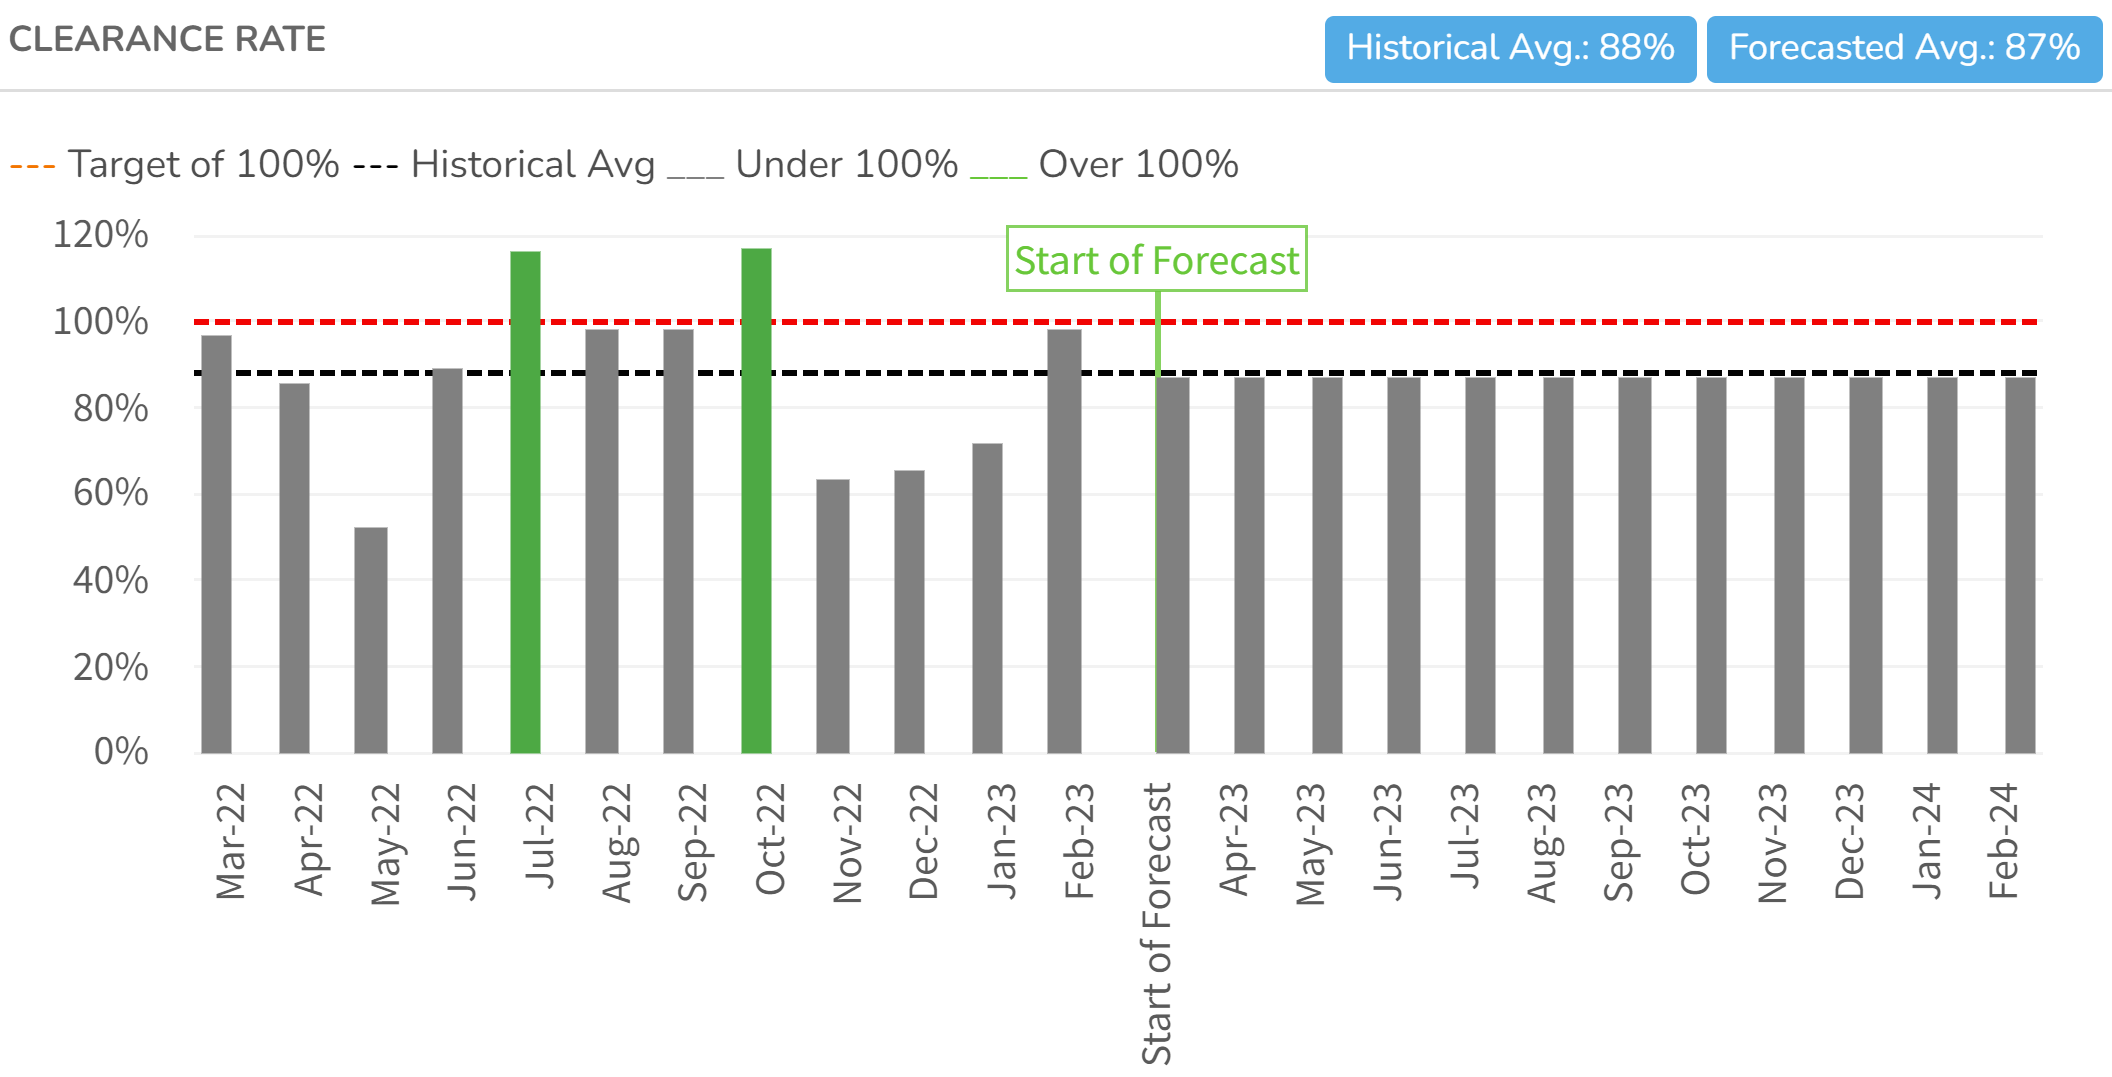
The target clearance rate is 100 percent, but some monthly fluctuations around this target are to be expected. The annual clearance rate summarizes the information presented and provides an overall picture of how well the court performed at closing cases compared to the number of incoming cases in the year. In this example, the average clearance rate for the historical 12-month period, shown in a blue box at the top, was 88 percent. It forecasts an average rate of 87 percent for the next 12-month period (before any interventions). More noticeably, the historical average is shown as a black dashed line and is lower than the target of 100 percent, shown as a red dashed line.
With this information, it may be worthwhile to investigate and track factors leading to particularly high or low clearance rates in any given month. These could be related to a surge in the number of case filings or administrative case closures, among other possibilities. But they could also demonstrate the impact of some intervention or backlog reduction strategy. The tool also lets the user explore the trends in filings and dispositions (not shown) to help pinpoint important trends and measure impacts of policy interventions.
What Are Examples of Interventions to Reduce Backlog?
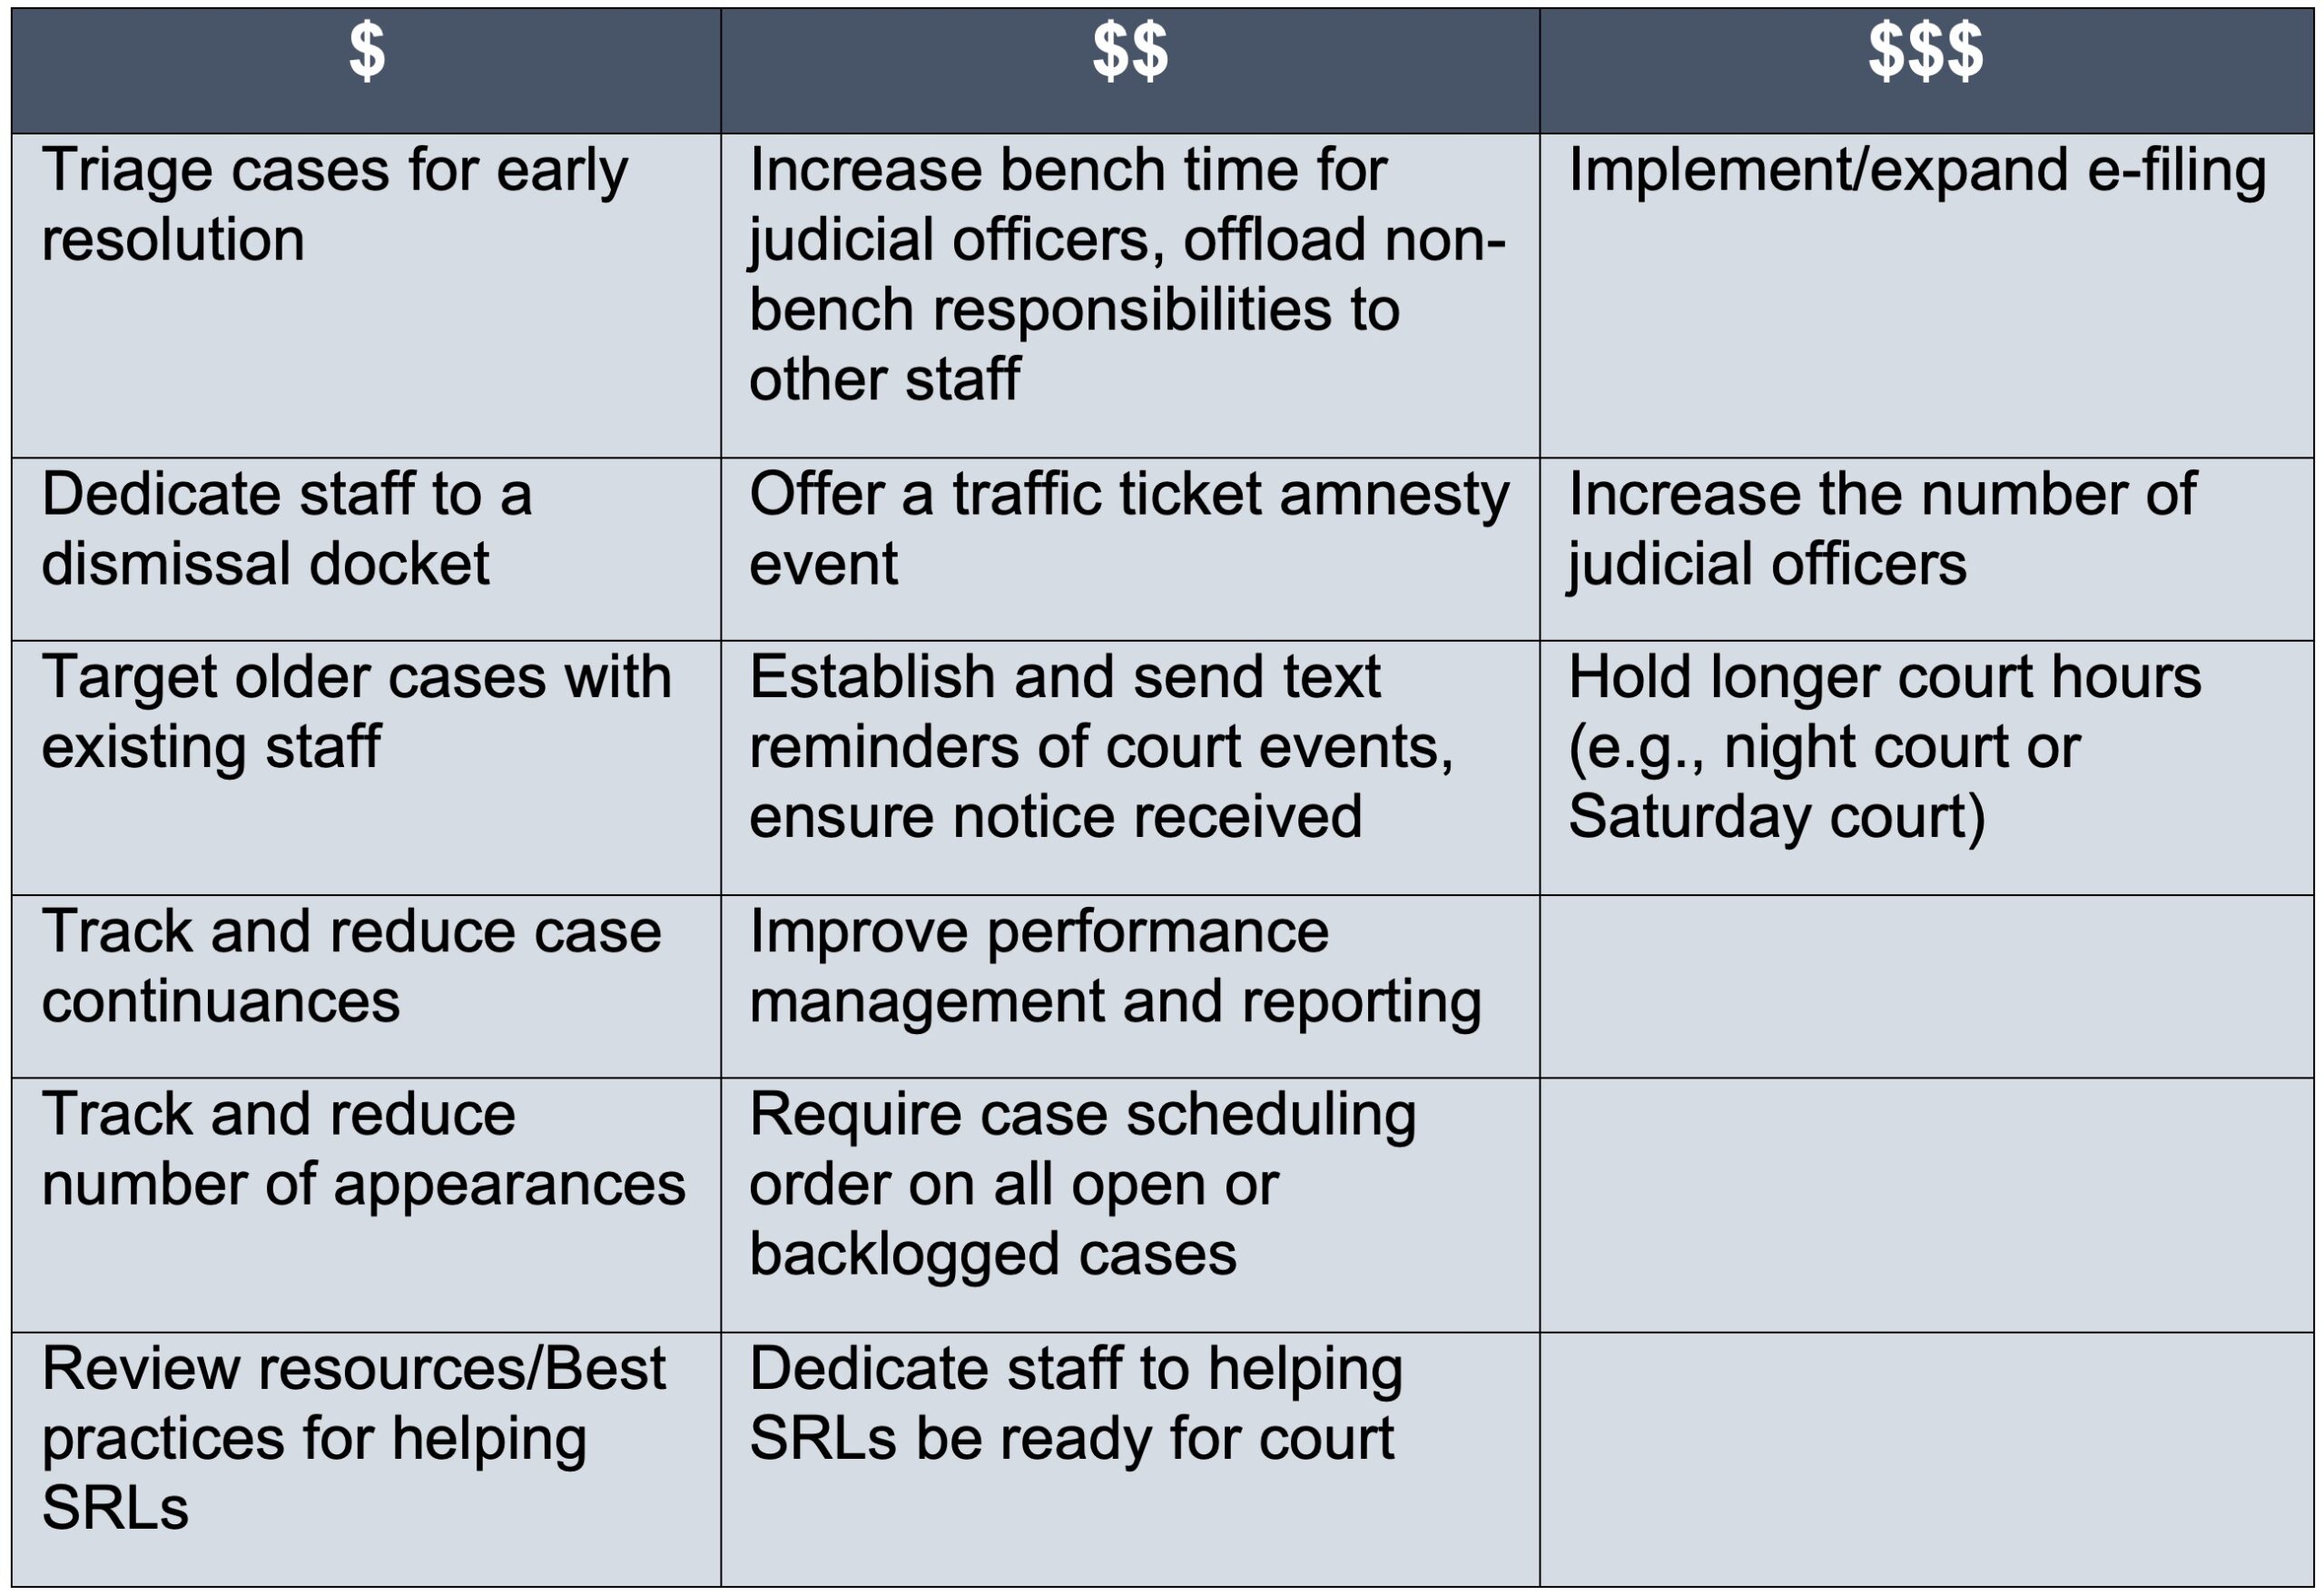
Users can simulate the impacts of different strategies to boost their case clearance rate with the “interventions” feature. Figure 8 presents examples of interventions or strategies, organized by expected cost. One strategy to reduce pending and backlogged cases may be to create a dismissal docket with a goal of increasing monthly dispositions by 5 percent on average over the next year. A court could estimate the impact of this intervention in relation to their “target” pending caseload with this tool. This makes the data more actionable as courts look to answer important questions, such as does this intervention help us reach our goal and by how much in the next 12 months? Using forecasts of the number and age of future pending cases, courts can better support management of case assignments, resource allocation, and strategic priorities.
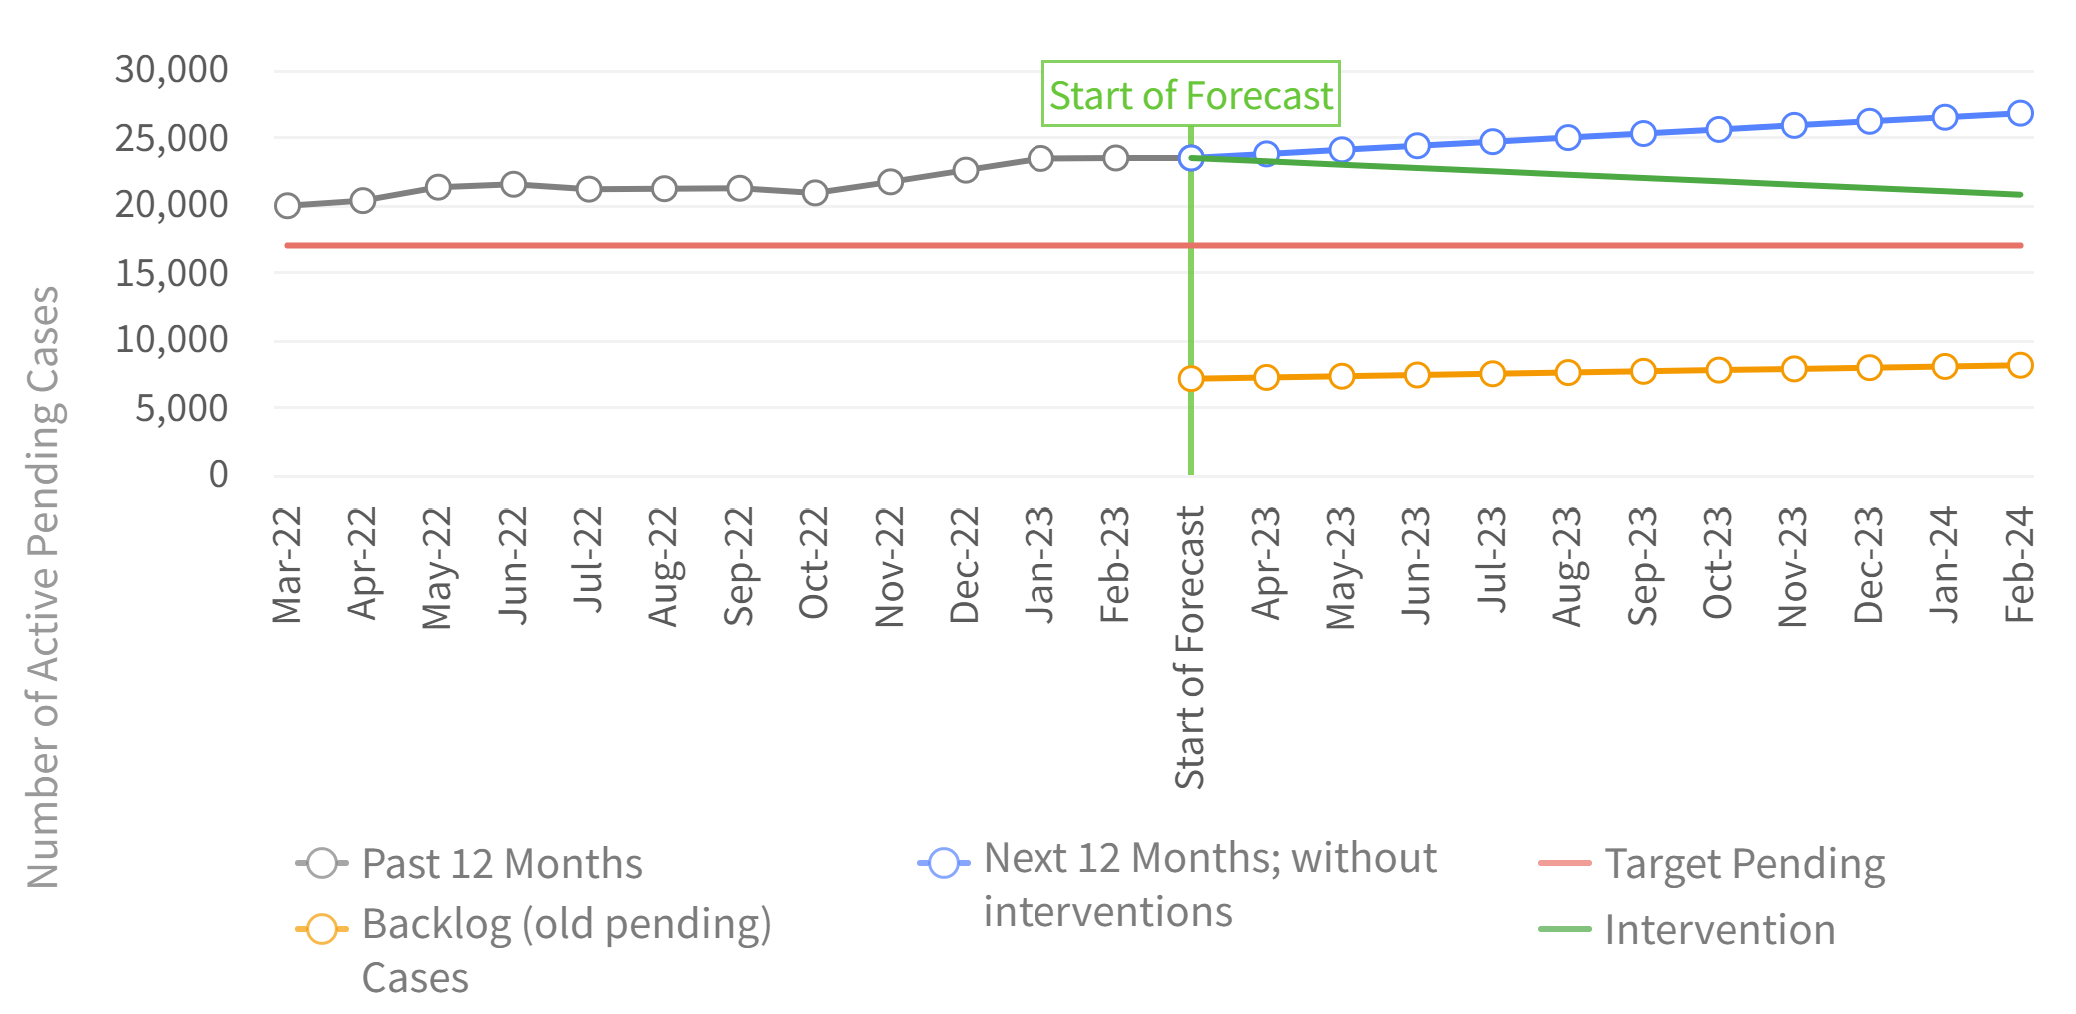
Overall, this tool makes it easy to see the implications of past performance and how it relates to changes over time, such as the potential for backlogs or court case delays. If the simulation shows a concerning growth in pending or backlog cases, a court may want to consider how implementation of effective caseflow management principles and practices can mitigate this growth.
ABOUT THE AUTHORS
Kelly Roberts Freeman is a senior court research associate, and Rory Monaghan is a research associate, with the National Center for State Courts.


